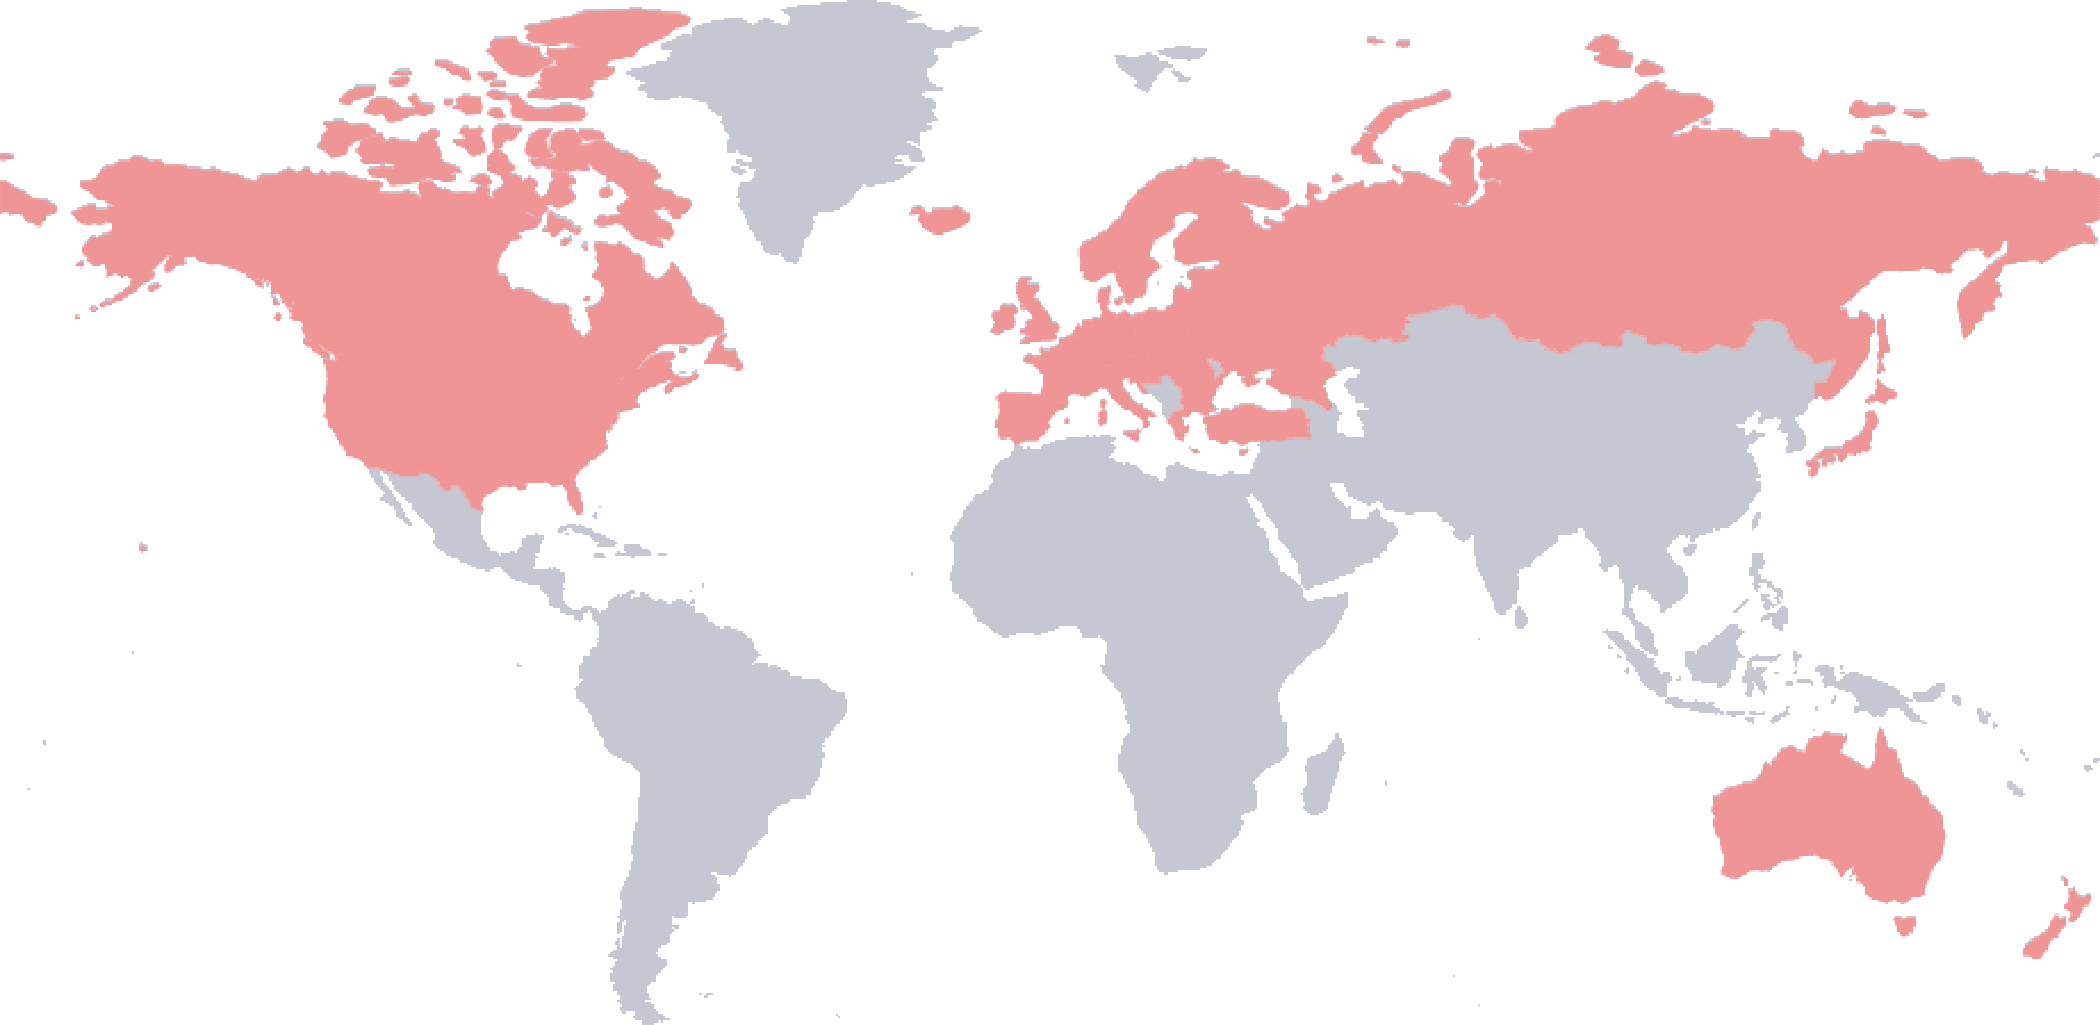
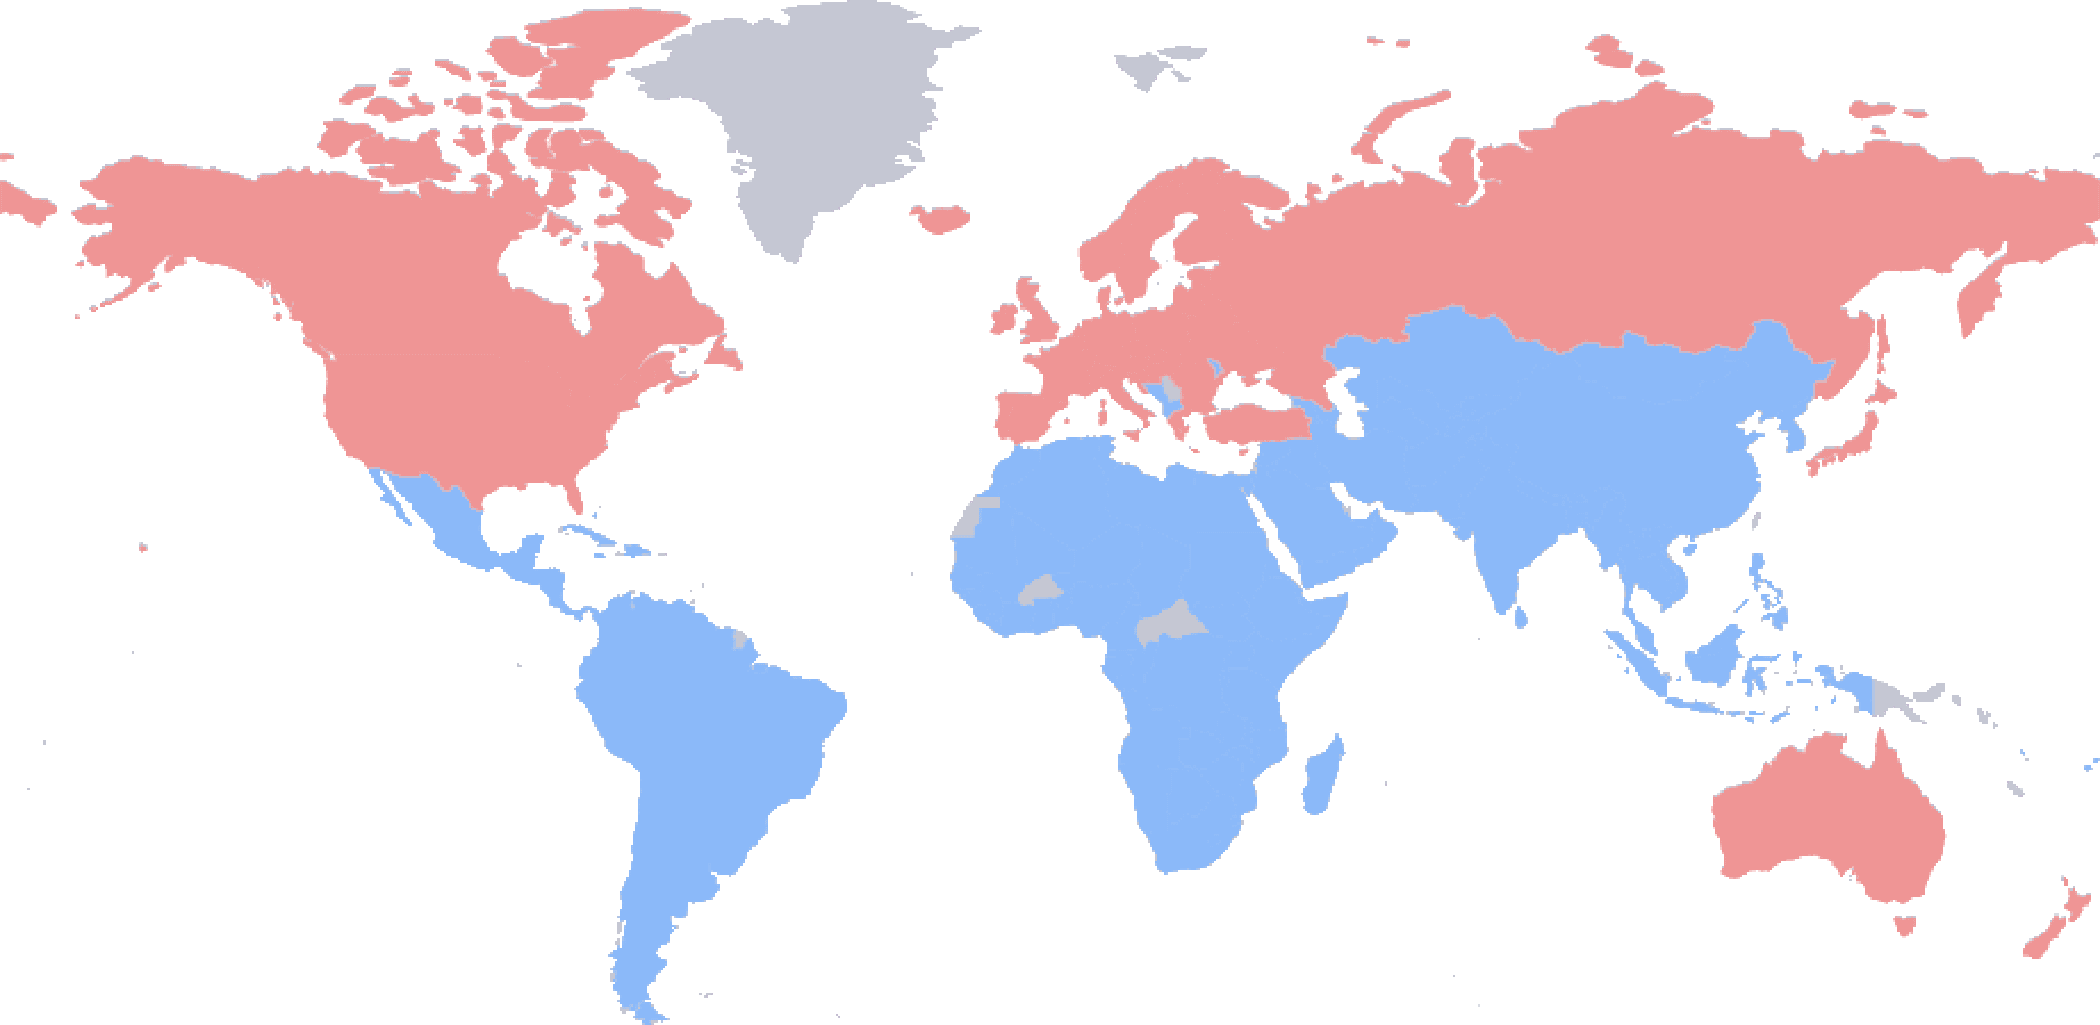
Countries covered by Article 4.8 of the UNFCCC
Article 4.8 of the convention states
"Article 4.8 of the convention states “In the implementation of the commitments in this Article, the Parties shall give full consideration to what actions are necessary under the Convention, including actions related to funding, insurance and the transfer of technology, to meet the specific needs and concerns of developing country Parties arising from the adverse effects of climate change and/or the impact of the implementation of response measures, especially on:Further, the Conference of the Parties may take actions, as appropriate, with respect to this paragraph.”
- Small island countries
- Countries with low-lying coastal areas
- Countries with arid and semi-arid areas, forested areas and areas liable to forest decay.
- Countries with areas prone to natural disasters
- Countries with areas liable to drought and desertification
- Countries with areas of high urban atmospheric pollution
- Countries with areas with fragile ecosystems, including mountainous ecosystems.
- Countries whose economies are highly dependent on income generated from the production, processing and export, and/or on consumption of fossil fuels and associated energy-intensive products.
- Land-locked and transit countries.